For families deciding where to live in Australia, the practical question is which location fits their work, housing budget and daily routine. No Australian city is best for every household.
Choose a location for your family
Start with three questions: where adults can find suitable work, what housing costs in suburbs you would consider living in, and whether daily life works for the household. Sydney, Melbourne, Brisbane, Perth, Adelaide, Canberra and regional centres all warrant investigation. No current, comparable measure ranks Australian cities specifically for family life.
Estimate the household income you are likely to have, then compare it with local rent or purchase prices and regular costs such as transport and childcare. A city’s reputation for affordability says little about whether a particular suburb fits your budget.
Test daily practicalities by checking commuting times, schools and childcare. Also look at nearby health services, public transport, and support from relatives or friends. These factors vary sharply between suburbs, so city-wide comparisons only provide a starting point.
The Australian Urban Observatory’s Urban Liveability Index measures access to schools, childcare, health services, transport and local jobs. Its published city data are from 2018, so the index offers families no current ranking.
Compare jobs and housing
Australia’s seasonally adjusted unemployment rate was 4.6% in August 2026. According to the ABS Labour Force release, trend unemployment was 4.3% in New South Wales and 5.1% in Victoria. Queensland, South Australia and Western Australia each recorded 4.4%. The rate was 5.2% in Tasmania, 4.8% in the Northern Territory and 4.0% in the ACT. Trend estimates smooth short-term changes to show the underlying direction. The ABS recommends trend data for the ACT and NT because it does not publish seasonally adjusted estimates for those jurisdictions.
State and territory unemployment rates do not show vacancies in a city, demand for a parent’s skills, or how long a job search will take. For broader context, Jobs and Skills Australia’s September 2025 regional results rated about two-thirds of metropolitan regions as strong or above average. Almost half of regional areas rated below average or poor. Those results do not identify the best location for a particular household or occupation.
Housing figures also need local checking. The ABS put preliminary mean dwelling prices for the June quarter of 2026 at $1,304,900 in NSW, $1,130,600 in Queensland and $1,123,700 in Western Australia. These ABS dwelling estimates are state-wide means and subject to revision. They do not show city medians, local rents or what a family can afford.
Compare current rents and sale prices in shortlisted suburbs or towns with expected household income, commuting costs and the location of suitable jobs.
Compare city and regional options
Use these places as a shortlist, not a ranking. Check current vacancies near likely workplaces, then compare housing costs, transport costs and commuting times in realistic neighbourhoods.
Sydney
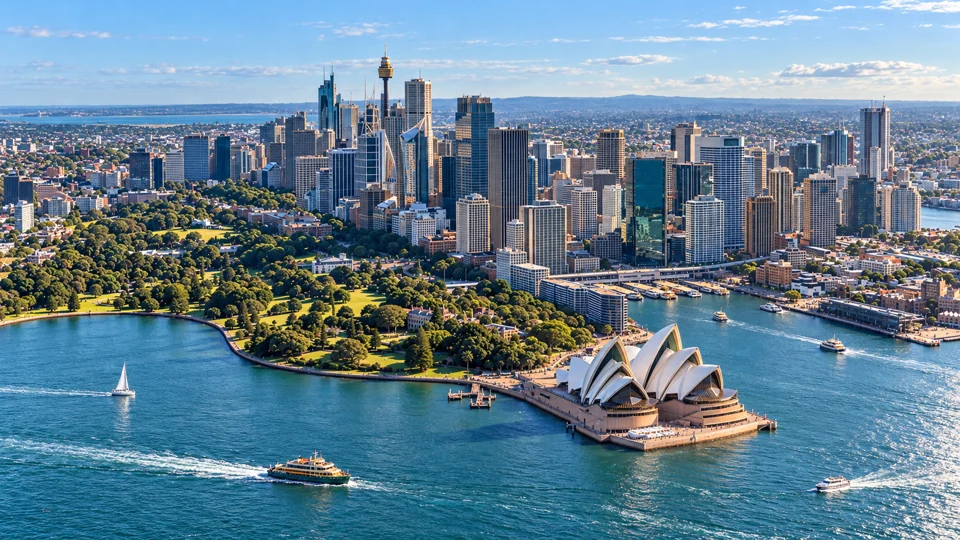
Consider Sydney when suitable work and preferred suburbs fit the household budget. NSW’s trend unemployment rate was 4.3% in August 2026, and the state’s mean dwelling price was $1,304,900 in the June quarter of 2026. Both figures cover NSW as a whole, so compare Sydney housing costs, transport costs and travel times directly.
Melbourne
Consider Melbourne when local vacancies and neighbourhoods suit the family. Victoria’s trend unemployment rate was 5.1% in August 2026. That statewide measure does not forecast job prospects in Melbourne or in a particular occupation. Compare likely work locations with housing and transport costs in the suburbs under consideration.
Brisbane
Consider Brisbane when local work and housing suit the household’s needs. Queensland’s trend unemployment rate was 4.4% in August 2026. The state’s mean dwelling price was $1,130,600 in the June quarter of 2026, but that figure does not show Brisbane’s housing costs or how they compare with other capitals. Use local prices and expected household income.
Perth
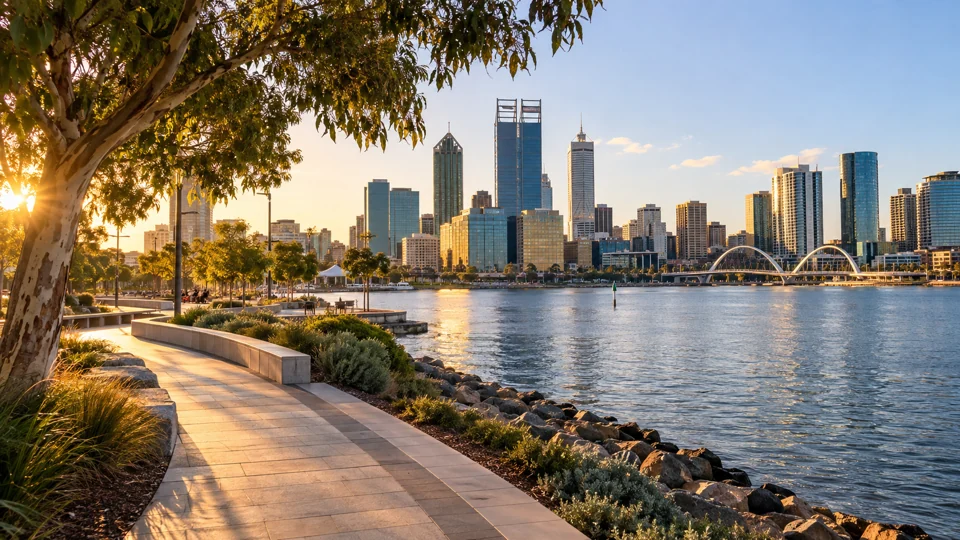
Consider Perth when suitable work and housing fit daily travel needs. Western Australia’s trend unemployment rate was 4.4% in August 2026, and the state’s mean dwelling price was $1,123,700 in the June quarter of 2026. Neither figure describes Perth alone. Check occupation-specific vacancies and housing costs in the suburbs under consideration.
Adelaide
Compare Adelaide job openings with suburbs and housing costs that suit the household. South Australia’s trend unemployment rate was 4.4% in August 2026. Jobs and Skills Australia described Greater Adelaide’s labour-market conditions as robust in September 2025 while noting local challenges. That regional assessment does not guarantee work in a particular field.
Canberra
Consider Canberra when available jobs match the household’s occupations. The ACT’s trend unemployment rate was 4.0% in August 2026, with an employment-to-population ratio of 68.8% and a participation rate of 71.6%. The ABS recommends using trend data for the ACT. Compare vacancies and local housing costs separately, because these figures do not measure affordability or prospects in a specific occupation.
Regional centres
A regional centre may suit a family with a local job offer, nearby support or a clear lifestyle reason to live there. Jobs and Skills Australia’s September 2025 results found that almost half of regional areas had below-average or poor labour-market conditions, and all remote regions fell into those categories. Check vacancies, housing, schools, healthcare and transport in the specific town before relocating.
Compare suburbs and services
Choosing a city narrows the search area. The suburb determines much of daily family life, including the commute and access to essential services.
Compare suburbs where household members could realistically live, study and work. Check school enrolment rules and whether childcare has vacancies. Look at nearby GPs and hospitals, as well as public transport routes. Compare door-to-door travel times to work. A service may look close on a map yet have no vacancies or limited hours. It may also lack a practical transport connection.
The Australian Urban Observatory Liveability Index includes 13 measures, including access to schools, childcare, health services, public transport and local employment. Its published city index uses 2018 data. Use the measures to identify what matters to your household rather than as a current ranking of suburbs.
Use ABS Census area data to compare local household, education, employment and community patterns. Confirm current childcare places, school enrolment information, health-service availability and travel options directly with providers and transport planners. No comparable, current dataset ranks Australian suburbs across school quality, safety, healthcare access and environmental conditions.