For people planning a move to Melbourne, housing, location and transport are the main parts of a household budget. National cost indexes show how household expenses are changing across Australia, but they do not provide a Melbourne household budget.
In the year to June 2026, the ABS Living Cost Indexes rose by 3.7% to 4.7%, depending on household type. Housing, food, and insurance and financial services were among the main contributors. These indexes track expense changes for selected household types nationwide.
Households in the City of Melbourne local government area spent a modelled $5,386 on utilities in 2024/25, expressed in 2023/24 base-year dollars, according to economy.id. It does not represent a Greater Melbourne budget or a typical household utility bill.
Housing costs differ sharply by suburb and dwelling type. In the five years to December 2025, median house prices rose by an average of 3.2% a year across Greater Melbourne and 1.3% a year in Melbourne City. Median unit prices rose by 0.2% a year across Greater Melbourne and fell by 4.1% a year in Melbourne City, according to housing.id market data.
Rent and buying trade-offs
Compare rental and purchase costs separately. Over the same five-year period, median unit rents rose by an average of 8.1% a year across Greater Melbourne and 10.2% a year in Melbourne City. Median house rents rose by 5.8% and 3.9% a year respectively.
These are average annual changes over five years, not current asking rents, sale prices or forecasts. housing.id publishes entry-level, median and upper-level series, which help distinguish lower-cost, middle and higher-cost parts of each market. Check the period, dwelling type and geography before comparing figures. Melbourne City data does not represent every Melbourne suburb.
Rental affordability pressure extends beyond Melbourne. The Victorian Council of Social Service reports, using Homes Victoria data, that 14% of rental properties advertised across Victoria met affordability criteria for low-income households in September 2025 (VCOSS). That statewide figure provides context, not an affordability estimate for Melbourne.
Choosing a Melbourne suburb
A suitable suburb balances housing costs with the trips a household makes each week. Compare homes of the right type and price with travel to work, schools, shops, health services and public transport.
Victoria’s planning regions provide a broad way to locate areas within metropolitan Melbourne. The Inner Metropolitan region includes Melbourne, Port Phillip and Yarra. The Inner South East includes Bayside, Boroondara, Glen Eira and Stonnington. The Western region includes Brimbank, Hobsons Bay, Maribyrnong, Melton, Moonee Valley and Wyndham under the Victorian Government’s Victoria in Future planning framework.
Footscray, Kensington, Coburg North, Maribyrnong, Altona North, Braybrook, Maidstone and Brooklyn offer useful comparisons across inner and western Melbourne. Review the available homes in each area, then check the routes and services that matter to the household. A suburb name or planning region does not show whether a specific property fits the budget or daily travel needs.
Compare housing by area
The housing.id market series reports trends for Greater Melbourne and Melbourne City to December 2025. It separates houses from units and sale prices from rents. Use the series that matches the dwelling type and tenure you are considering.
These figures cover broad areas rather than the price of a particular suburb or property. A useful suburb comparison identifies the dwelling type and sale or rental period. A median house sale price for a quarter answers a different question from a weekly asking rent for units listed in a month.
Check current listings within the budget, then test trips to work, education, shopping and other regular destinations. Housing costs and travel time shape daily life more directly than an area’s regional classification.
Getting around Melbourne
Transport affects both weekly travel time and household spending. economy.id notes that households in areas with good public transport and access to jobs may spend less on transport. The source describes a general relationship; it does not report a measured result for every Melbourne household.
Myki is Melbourne’s ticketing system for Metro trains, trams and buses. For Metro train travel, touch on at the station before boarding and touch off after leaving the station. Metro’s ticket information explains how to buy and top up a myki card; Public Transport Victoria lists current myki fares, which change from time to time.
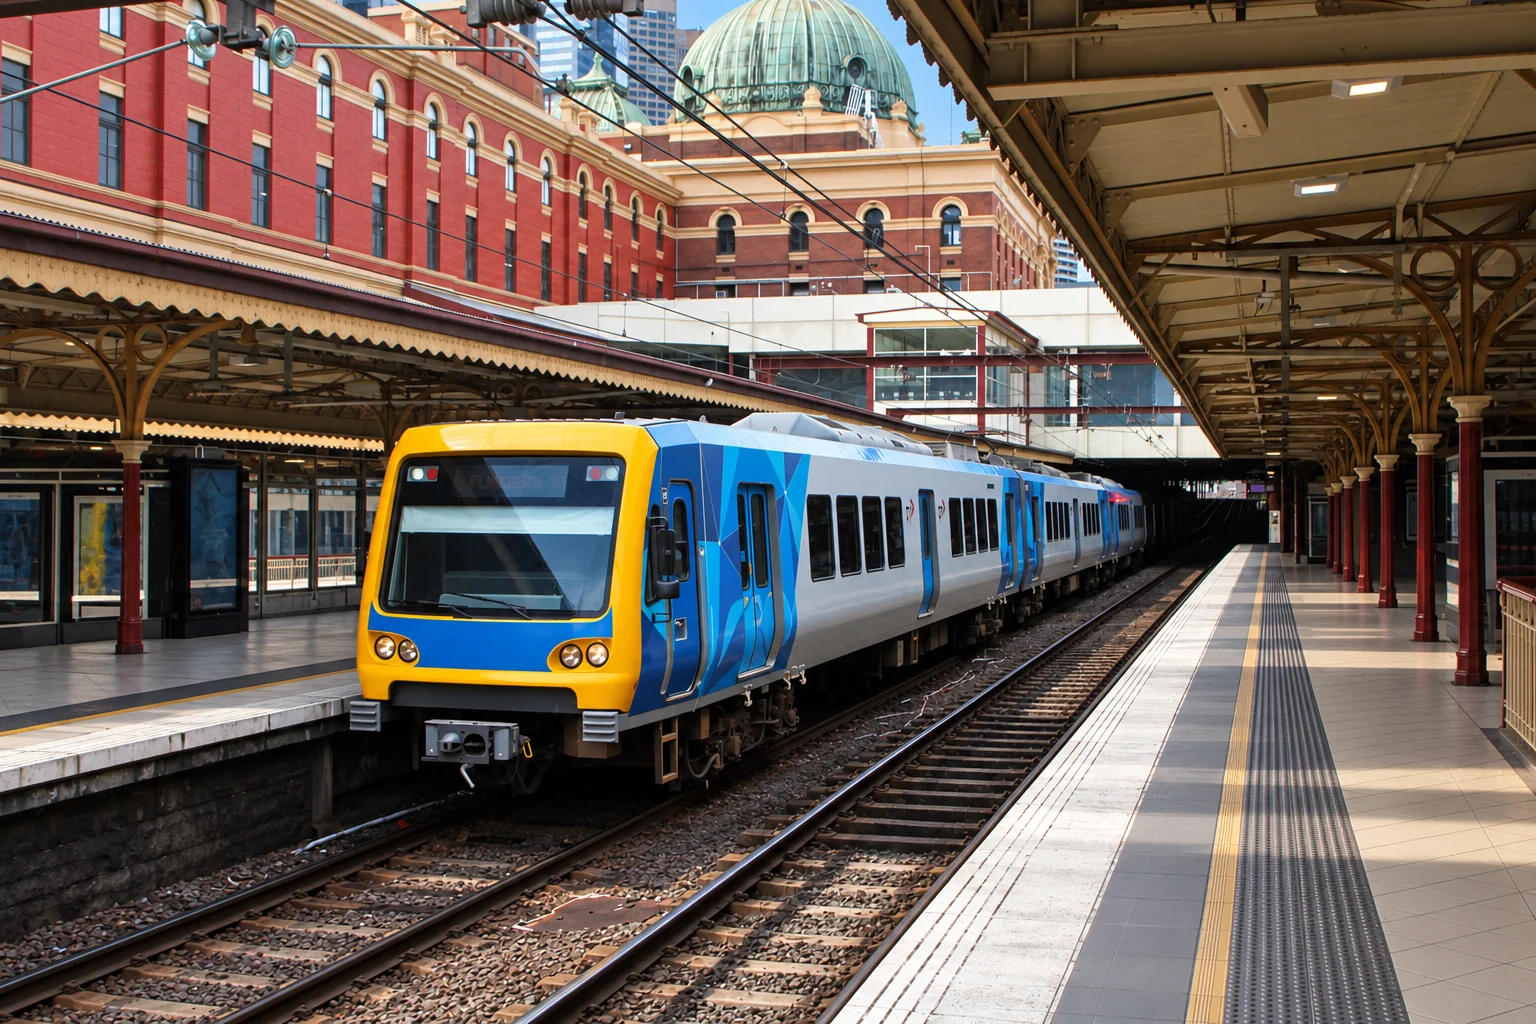
Test the trips you expect to make each week, including work, school, shopping, medical appointments and visits to family or friends. Check the route from the specific address, including timetables and interchanges, and use Public Transport Victoria’s disruption information for current planned works and service changes. Melbourne-wide averages do not show whether a home suits regular travel.
Melbourne culture and sport
Melbourne hosts cricket and AFL matches at the MCG, as well as the Australian Open and the Formula One Australian Grand Prix. Its cultural calendar includes the Melbourne International Film Festival and the Melbourne International Comedy Festival. Study Melbourne lists these events among the city’s regular sporting and cultural attractions. They provide access to major sport, film and live performance throughout the year.
LSJ Online reported that Melbourne ranked fourth globally, with a score of 97, in the Economist Intelligence Unit’s 2025 Global Liveability Index. Study Melbourne says Melbourne ranked third in a 2026 index. That Victorian Government page promotes Melbourne to international students and does not describe the 2025 EIU result.
Events and liveability rankings provide only part of the picture. Affordable housing near work and services produces a different daily experience from high rent or a long commute.