Families choosing a Brisbane suburb usually weigh five things: schools, parks, public transport, flood risk and price. No suburb scores best on all five. Build a shortlist of suburbs where Brisbane City Council’s family parks, a workable train or bus link and a clear flood result for the specific address all line up, then test each against your budget. Published price data covers the city and broad regions, not individual suburbs, so the price figures show the wider market, while parks, transport and flood tools decide the suburb picks.
Brisbane City Council’s area, the Local Government Area (LGA), covers every suburb discussed here. Council publishes the flood maps and park lists that do most of the screening. Queensland school data comes from the Australian Curriculum, Assessment and Reporting Authority (ACARA), and fares come from Translink, which runs public transport across South East Queensland (SEQ). October to March is Brisbane’s storm season, so a flood check matters most if you are inspecting properties now.
How to Build a Shortlist
Start with the flood screen, because it can remove a suburb or a street from contention regardless of its schools or parks. Next, map the schools near each candidate using ACARA’s school location data. Then check each suburb’s parks, test the trip to work or school on Translink’s journey planner, and finish with price and rent checks. Doing flood first saves time, and doing price last means you compare suburbs that already meet your other needs.
Treat the suburbs named later as candidates that meet specific criteria. A suburb with an excellent fenced playground can still have flood-affected streets, and a suburb with a train station can have a limited choice of homes in your budget.
Checking Flood Risk Before You Buy
Council offers two tools, and each answers a different question. The Flood Awareness Map covers the whole Brisbane LGA and lets you search by address, lot plan or suburb. It shows possible flood extents based on the best data Council holds, along with historic flood events, but it does not show real-time flooding. Council names four common sources of flooding in Brisbane. Two are creek flooding and river flooding. The others are overland flow and storm tide or high tide. Overland flow is stormwater running across the ground after heavy rain before it reaches a creek or drain. The map displays the likelihood of flooding from very low to high for each source, and you can switch on layers showing whether a property was affected in past events.
Use the map to screen suburbs, then order the FloodWise Property Report for any property you are serious about. You generate it from the map using the "Technical FloodWise Property Report" button, and it takes about 20 seconds. The report includes a flood summary graph, historic flood levels and estimated flood levels. It also gives the minimum habitable floor level, which is the lowest height at which a living area is allowed to sit under Council’s planning rules. Where they exist, it compares levels from January 2011 and February 2022. Flood levels for river, creek and storm tide are listed at five annual exceedance probability (AEP) values: 0.2%, 1%, 2%, 5% and 20%. AEP is the chance of a flood of that size occurring in any one year, so 20% is the most likely and 1% is much rarer.
The report’s aerial map outlines the lot in red and shades the combined 1% AEP area for river, creek and storm tide, but it does not show overland flow. Overland flow appears on the Flood Awareness Map and as a development flag, such as an overland flow path, in the report’s overlay section, so read that section as well as the picture. Council also states that the report uses only currently adopted information from Brisbane City Plan 2014 and may be incomplete, so a clean result is a strong indicator, but it does not guarantee a flood-free address. If you want a second look, the Queensland Government’s FloodCheck map shows state flood study extents, and a commercial flood check service offers a free layer check with a full PDF report at $49.
Once you buy, sign up for Brisbane Severe Weather Alert, which sends email, SMS or phone alerts for floods, storms, cyclones and planned burns in six languages. The Bureau of Meteorology’s flood knowledge centre and Get Ready Queensland cover preparation. Properties close to the Brisbane River or its creeks warrant the most careful report reading, and that includes homes near river-frontage parks such as Colmslie Beach Reserve and Rocks Riverside Park.
Using My School Data
My School is ACARA’s website covering every school in Australia, with student profiles, NAPLAN results, funding, enrolment and attendance. NAPLAN is the national literacy and numeracy test. ACARA states that My School has no league tables, that ranking schools is not its purpose, and that NAPLAN "provides information on only one aspect of school performance and does not measure overall school quality." It advises parents to visit schools and talk to teachers and principals.
My School adds two things to a raw score. It compares a school’s NAPLAN results with those of students from similar backgrounds, taking into account parental education and employment, the school’s location and the Indigenous status of its students. It also measures student progress as the change between one NAPLAN test and the next, two years later. A school with modest raw results and strong progress tells you something different from a school with high results and flat progress. No progress is reported for 2020 to 2022 or 2021 to 2023, because NAPLAN was cancelled in 2020 and its scoring scale was reset in 2023.
To look at schools suburb by suburb, ACARA’s Data Access Program offers downloadable spreadsheets. The School Location 2025 file lists every school with its longitude, latitude and LGA, which makes it the quickest way to plot schools around a candidate suburb. The School Profile 2025 file adds enrolments, ICSEA (a measure of socio-educational advantage), language background and socio-economic attributes. School-level NAPLAN results for 2026 arrive when My School refreshes in December 2026. The My School terms of use, last updated July 2020, restrict building lists that compare school performance for commercial purposes, so use the data for your own shortlist and confirm enrolment arrangements directly with each school.
Family Parks by Suburb
Council manages over 2180 parks, and its family list names a dozen with specific features. The list is a curated selection, so a suburb missing from it can still have good local parks. Council’s parks map is the place to look for the rest.
Inner north and north-west
Ascot Park, on the corner of Lancaster and Kitchener roads, is fully fenced and suited to young children, with a fire engine, cubbies, swings and a roundabout. Fully fenced parks matter most for toddlers and for parents with more than one child to watch. Nearby in Kedron, the Bradbury Park playscape at 91 Kitchener Road has towers, bridges and forest-themed play, plus a scooter track, a basketball half court, exercise equipment and a dog park, so it suits a wide range of ages.

Further north-west, Everton Park’s Teralba Park at 120 Pullen Road has a ninja-style course with 11 obstacles, which appeals to older primary-age children. Fenwick Park at 682 Samford Road, Mitchelton, has slides, zip-lines and swings, and Council notes it suits picnics and birthday parties. In Taigum, Fernwood Place Park has shade sails over its playground, and Shorncliffe’s Moora Park is a short walk from Shorncliffe Station, which is useful for families who want a train-accessible outing. Council’s sun-safe playground list names the Taigum and Shorncliffe parks.
In Deagon, Deagon Sportsground Park at 83 Board Street combines a skate park, electric barbecues and a playground.
East and bayside
Murarrie’s Colmslie Beach Reserve at 152 Colmslie Road has a playground with slides, climbing, water play and a flying fox. It also has picnic facilities, electric barbecues, a learn-to-ride track and Brisbane River frontage. Hemmant’s Paul Conti Park at 124 Hemmant Tingalpa Road has an island-themed playground, a picnic shelter and a scooter track. Both sit in areas where a river or creek flood check is a sensible first step, given the waterfront setting.
South and south-west
Macgregor’s D. M. Henderson Park at 434 McCullough Street has a pirate-ship playground, sporting courts, picnic facilities and a newly built pump track. Rochedale’s Fischer Family Park at 12 Blackwood Street has a 100-metre walking track, a shaded playground, picnic tables and open space for play and sport.
Seventeen Mile Rocks has Rocks Riverside Park at 531 Seventeen Mile Rocks Road. It has a Great Lawn, a junior playground, a climbing net and gas barbecues. Council’s park upgrades page describes an 800-metre riverside pathway and a sand pit there. In Durack, Archerfield Wetlands District Park at 455 Bowhill Drive turns a former wastewater treatment plant into a playground with a super slide and a basketball court.
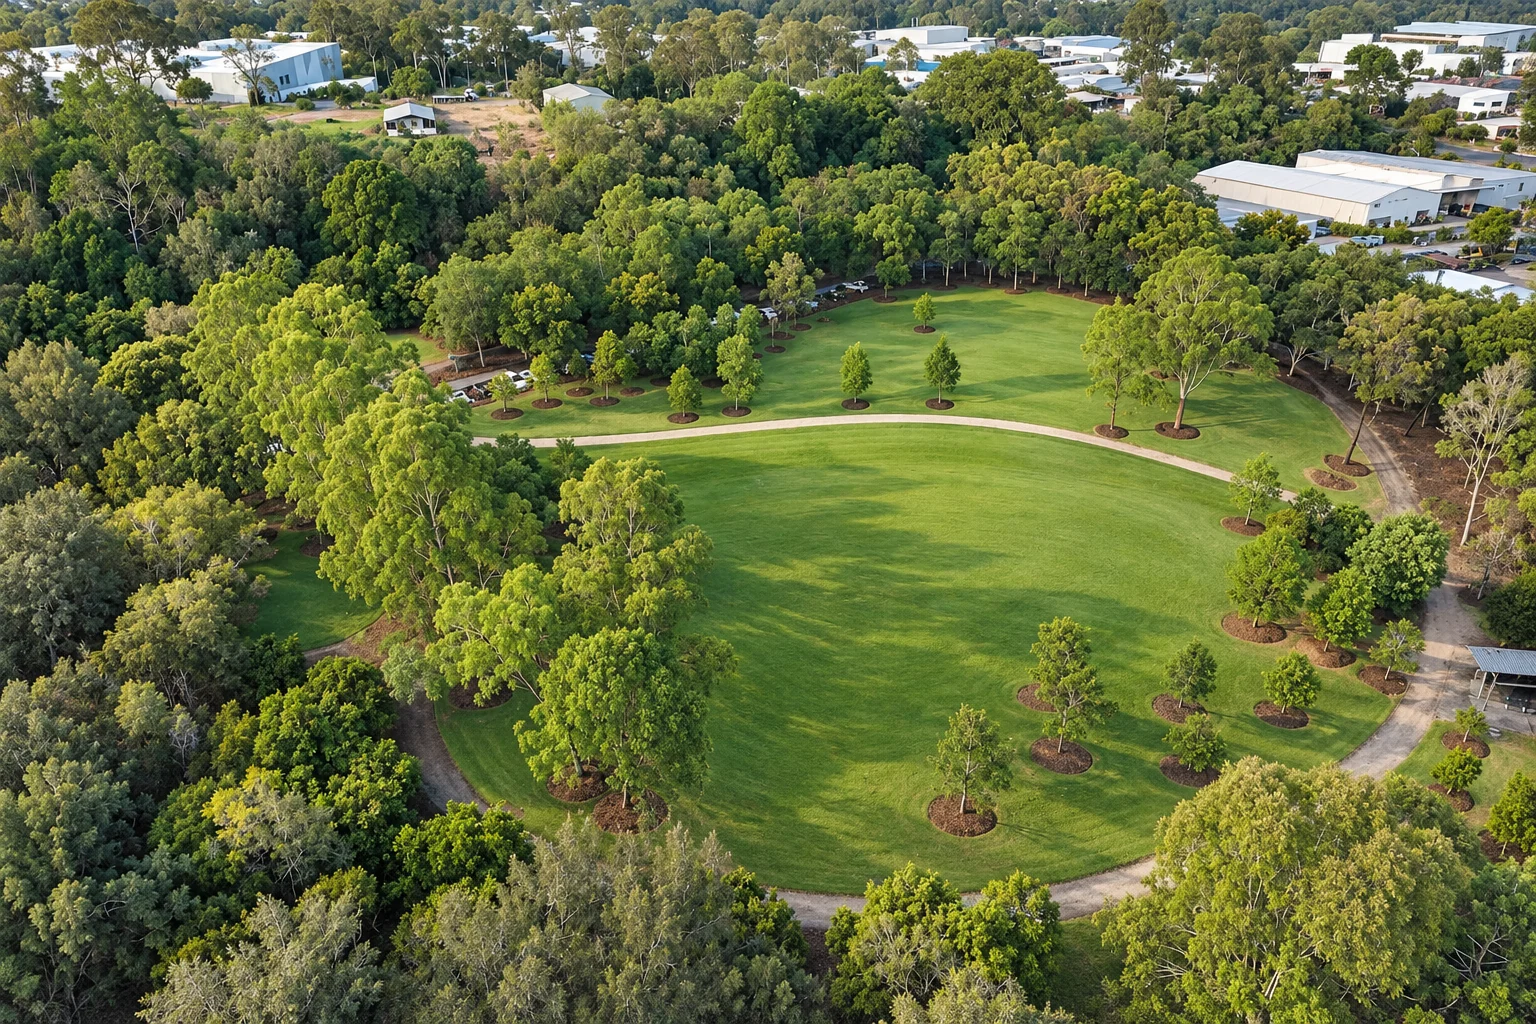
Chapel Hill’s Clarina Street Park at 2A Clarina Street has an unfenced playground among trees, with a barbecue and picnic area, so it suits older children better than toddlers. Sherwood has the Sherwood Arboretum, with more than 1,350 trees on 15 hectares and two playgrounds, one under shade sails and one nature play.
Getting Around on Public Transport
Public transport across the SEQ network currently costs a flat 50 cent fare across all zones and modes. It covers Queensland Rail City Train services, buses (excluding dedicated school buses), Brisbane City ferries, the Southern Moreton Bay Island Ferry, trams and on-demand services. Airtrain is excluded and sells its own fares. You can pay with a go card, a credit or debit card or a paper ticket. While the flat fare applies, the 20% off-peak discount, 50% concession fares and frequent-journey discounts do not apply.
Children aged four and under travel free at all times, and children aged five to 14 travel free on weekends with an orange child go card. Senior Concession Card holders travel free on Brisbane City Council buses off-peak. Check Translink’s fare page for the current position, since flat-fare arrangements are a time-limited policy.
Service changes affect commutes, so look at line status before settling on a suburb. On Translink’s homepage as of 28 October 2026, the T1 Nambour and Gympie North line showed a major upcoming change, while T1 Caboolture, T1 Ipswich and Rosewood, T2 Kippa-Ring and T2 Springfield Central showed minor upcoming changes, and T3 Doomben showed a minor change. Run your own trip at the hour you would travel on Translink’s journey planner.
Cross River Rail is building an underground line beneath the Brisbane River with four new underground stations in the inner suburbs and upgrades to existing stations on the Beenleigh and Exhibition lines. The expected opening is 2029, which is too late for a move this year, though it matters if you plan to stay long term in an inner-suburb catchment.
Prices and Rents Across Brisbane
Cotality’s September 2026 data, reported in NAB’s Brisbane market insights, puts the Brisbane median house value at $1,146,078. Values have fallen over the quarter but remain higher than a year ago:
| Measure | Brisbane median value | Monthly | Quarterly | Annual |
|---|---|---|---|---|
| Dwelling | $1,048,880 | −1.5% | −4.7% | +5.9% |
| House | $1,146,078 | −1.5% | −4.9% | +5.3% |
| Unit | $834,627 | −1.4% | −4.2% | +8.5% |
These values cover Brisbane as a whole and do not describe individual suburb medians. Units grew faster than houses over the year, which narrows the gap for families considering a townhouse or apartment. The report states the premium market recorded the sharpest declines and that the three-month falls were concentrated in the inner suburbs. House sales fell 22.9% year on year and sit 24.2% below the five-year average. House listings rose 0.6% year on year and unit listings rose 10.2%. Median days on market were 32. For a buyer, thin sales and rising unit listings point to room for negotiation, particularly in the inner suburbs.
Borrowing capacity has also tightened. The NAB report cites research showing that four Reserve Bank of Australia rate rises since February cut borrowing capacity by almost $90,000, about 9% of purchasing power. Ask a lender what you can borrow before you inspect homes.
For renters, the picture runs the other way. House rents rose 6.7% and unit rents rose 5.9% over the year, vacancy rose from 1.8% to 2.3%, and gross rental yield was 3.5%. Median rents were $775 per week for houses and $678 per week for units in September 2026.
By Cotality region, the strongest annual rise in dwelling values to September 2026 was in Goldfields (WA) at 23.8%, followed by Darling Downs (West)–Maranoa (Qld) at 20.0%. Across Greater Brisbane, the strongest rise was in Sherwood–Indooroopilly at 10.7%, followed by Ipswich Hinterland at 10.1%, Beenleigh at 9.1%, Caboolture at 8.7%, Springfield–Redbank at 8.5%, Forest Lake–Oxley at 8.2%, Sandgate at 8.1% and Redcliffe at 7.9%. Strong growth means higher entry prices for families arriving now, so the regions where growth has been slower may offer more room within a fixed budget. Once you have shortlisted suburbs, compare recent sales of similar houses in each one rather than relying on regional figures.
Key Takeaways
- Run the flood check at two levels: Screen suburbs on Council’s Flood Awareness Map, then generate a FloodWise Property Report for each address, and read the overlay and development flags for overland flow because the report’s aerial map omits it.
- Use school data as one input: ACARA’s My School has no league tables and treats NAPLAN as one aspect of quality, so combine its progress data and the School Location 2025 file with school visits.
- Shortlist from Council’s family parks: Ascot, Kedron, Everton Park, Mitchelton, Murarrie, Macgregor, Rochedale and Seventeen Mile Rocks all have named parks with playgrounds, barbecues and picnic areas, and several are fully fenced or shaded.
- Test the commute before you commit: Translink’s flat 50 cent fare keeps travel cheap for now, but line status changes, so run your real trip on the journey planner. Cross River Rail’s expected opening is 2029.
- Negotiate with the market in mind: The Brisbane median house value of $1,146,078 is down 4.9% over the quarter, with sales well below the five-year average, while house rents are up 6.7% on the year.